

SITCOMTN-164
AnaCal Shear Profile of Abell 360 in LSSTComCam Data Preview 1#
Abstract
This technote presents the measurement of the weak-lensing shear profile for the Abell 360 galaxy cluster using LSSTComCam data processed with the AnaCal pipeline. We detail the procedures involved in bright-star masking, source selection, and the estimation of tangential and cross shear around the cluster center. The resulting shear profiles provide key insights into the mass distribution of Abell 360 and demonstrate the capabilities of AnaCal in processing early LSST data, with the tangential shear profile detected at \(5\sigma\) significance.
Introduction#
The Rubin LSSTComCam observing campaign conducted at the end of 2024 targeted seven fields, including the low ecliptic latitude Rubin SV 38 7 field. This field hosts the Abell 360 galaxy cluster, an intermediate-mass cluster at redshift \(z = 0.22\), which we use as a commissioning case study to demonstrate Rubin’s capabilities for weak lensing analyses of galaxy clusters.
This technote is one part of a series studying Abell 360 in order to both stress test the commissioning camera and demonstrate the technical capabilities of the Vera Rubin Observatory. We study the quality of the PSF modeling and impact it can have on cluster WL in Combet et al. [2025], implementation of cell-based coadds and subsequent use for Metadetect [Sheldon et al., 2023] in Gorsuch et al. [2025], source selection of weak lensing galaxies in [Adari et al., 2025], photometric calibration in insert here, use of Anacal [Li et al., 2025] to produce a cluster shear profile here, and background subtraction in this field and Fornax in insert here.
AnaCal Shear Estimation#
AnaCal is an analytical framework to derive the shear response of galaxy shape, flux, detection and selection processes, offering a precise and generalizable approach to characterizing how weak gravitational lensing affects measurements from astronomical images. Instead of relying on numerical shearing or image simulations, the method starts from first principles by analytically computing how each pixel value in an image responds to an applied shear after PSF deconvolution and reconvolution with a Gaussian smoothing kernel [Li and Mandelbaum, 2023]. This pixel-level shear response captures the fundamental transformation properties of the image under lensing distortions.
Building on this, the framework then develops a way to propagate pixel-level shear responses to derived quantities—such as flux, moments, ellipticities, detection or selection—that are calculated as functions of the pixels. To do this systematically, the method introduces a mathematical formalism based on quintuple numbers [Li, 2025], a commutative ring to track shear response in the image processing. Each quintuple encodes not just the value of a quantity, but also its first-order derivatives with respect to shear, enabling propagation of shear responses through arbitrary differentiable algebraic operations.
To address noise bias, the method incorporates a “renoising” correction scheme. The idea is to construct a “renoised” image by adding a pure noise field—drawn from the same image noise distribution as the original image but rotated by 90 degrees. This rotation symmetrizes the noise contribution under shear distortion and allows the authors to analytically derive the correction term for noise bias in the shear response [Li et al., 2025]. The resulting correction is not only accurate but also avoids the need for calibration of noise bias with external simulations, maintaining the fully analytical nature of the shear response pipeline.
Bright Star Mask#
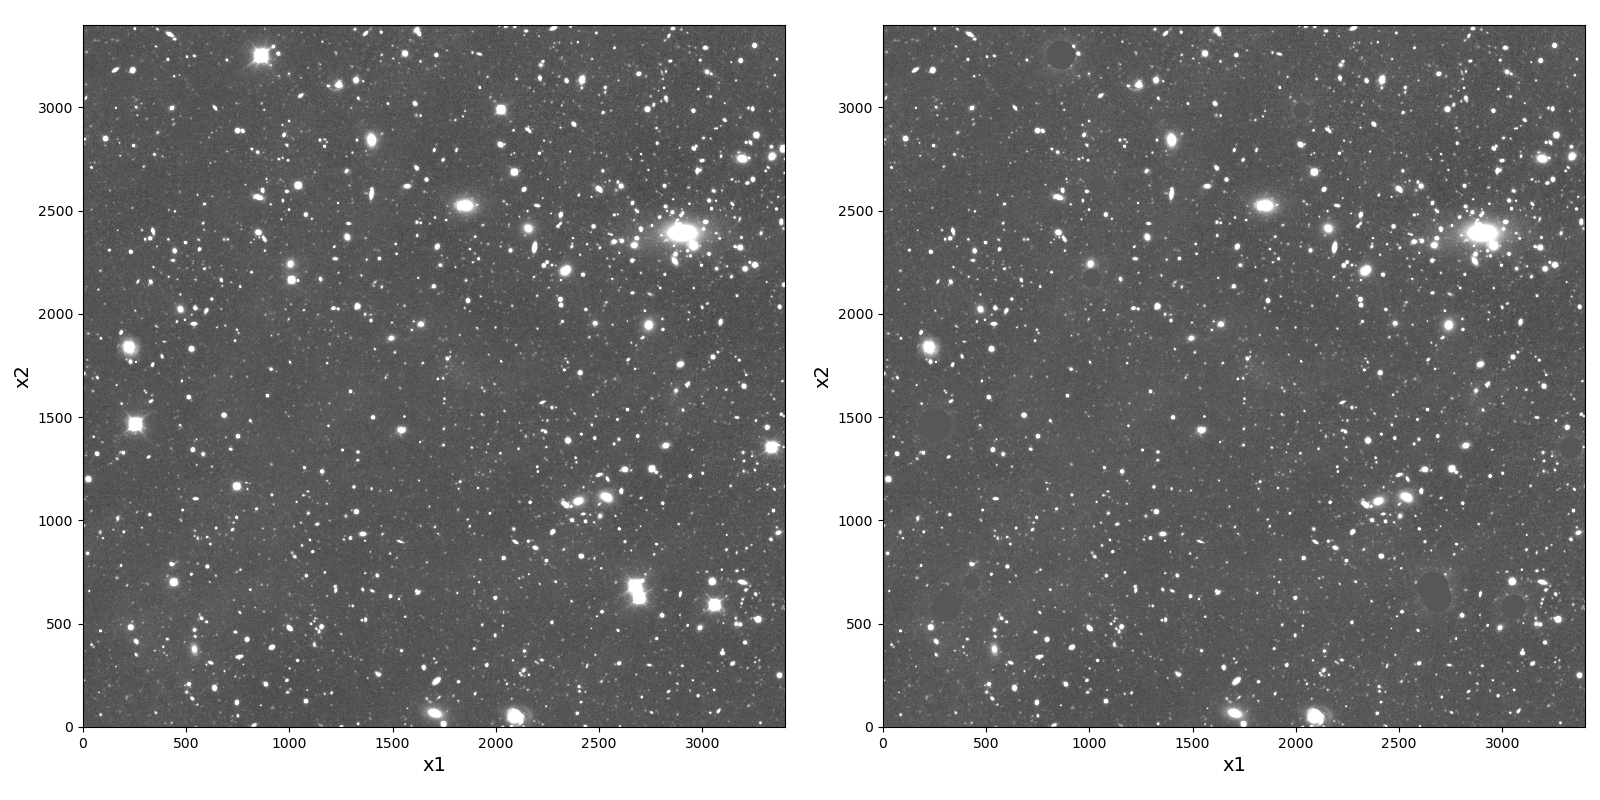
Fig. 1 Coadd \(i\)-band image of tract 10463, patch 61, before (left) and after (right) masking the bright stars.#
To derive the pixel-level shear response following Li and Mandelbaum [2023], each coadd image is first deconvolved by its native PSF and then reconvolved with a Gaussian PSF using the Fast Fourier Transform (FFT). The target PSF size is set to be larger than the native PSF to ensure the image processing pipeline is stable. To prevent contamination from saturated pixels and artifacts around bright stars during the convolution, we mask these regions prior to processing. As illustrated in Fig. 1, saturated stars are masked and set to zero using circular regions, with the mask radius visually chosen to encompass both the saturated cores and surrounding artifacts.
AnaCal Shape Catalog#
The shape catalog was generated using xlens version v0.5.3, and the task along with its configuration is summarized below.
AnacalDetectTask:
  class: xlens.process_pipe.anacal_detect.AnacalDetectPipe
  config:
    anacal.sigma_arcsec: 0.5
    anacal.badMaskPlanes = [
        "BAD",
        "CR",
        "CROSSTALK",
        "NO_DATA",
        "REJECTED",
        "SAT",
        "SUSPECT",
        "UNMASKEDNAN",
        "SENSOR_EDGE",
        "STREAK",
        "VIGNETTED",
        "INTRP",
        "EDGE",
        "CLIPPED",
        "INEXACT_PSF",
    ]
    anacal.do_noise_bias_correction: True
The 1-sigma size of the target Gaussian PSF is set to \(0.5\) arcseconds, corresponding to a full width at half maximum (FWHM) of 1.16 arcseconds. In addition to masking regions near saturated bright stars, pixels flagged by any of the anacal.badMaskPlanes are set to zero prior to deconvolution to suppress artifacts.
The pipeline is run on \(i\)-band coadd images, beginning with a 5-sigma source detection performed after smoothing the image with the target Gaussian kernel. Flux and shape measurements are then carried out for each detected source.
For the results presented in this technote, we adopt the flux from Gaussian model fitting as the fiducial galaxy flux (denoted as \(F\)). For shape measurements (\(e_1\), \(e_2\)) and trace radius (\(M_2\)), we use the FPFS ellipticity and trace radius derived using fixed-kernel Shapelets [Li et al., 2018, Li et al., 2022, Park et al., 2025]. Each of these quantities has a corresponding shear response, denoted as \(\frac{\partial F}{\partial g_{1,2}}\), \(\frac{\partial e_{1,2}}{\partial g_{1,2}}\), and \(\frac{\partial m_2}{\partial g_{1,2}}\). The shear is then estimated by
Additionally, the AnaCal flux is defined as \(\textrm{mag} = Z - 2.5\log_{10}(F)\), where \(Z\) refers to the magnitude zero point.
The following selection is applied to the catalog to select bright, well-resolved galaxies
Column |
|---|
g_mag \(\leq\) 23.5 |
r_mag \(\leq\) 24 |
i_mag \(\leq\) 24 |
z_mag \(\leq\) 24 |
\(M_2\) \(\geq\) 0.05 |
The shear-dependent bias caused by the selection is estimated and corrected using the shear response of Gaussian flux and trace radius.
Removing Red Sequence Galaxies#
Since cluster member galaxies are physically associated with the lensing structure, they do not exhibit a shear signal. To avoid diluting the measured lensing signal, such galaxies must be identified and removed from the source sample. We follow [Adari et al., 2025] to identify them through visual inspection of color–magnitude diagrams constructed in three different bands.
To identify the red sequence galaxies, we first limit our analysis to galaxies detected within 0.1° (≈1.3 Mpc) of the BCG. The resulting color-magnitude diagrams are presented in Fig. 2. Due to fewer observations in z we focus on the gri bands and the colors (g-r, r-i, g-i) from this set. We use AnaCal fluxes for the selection.
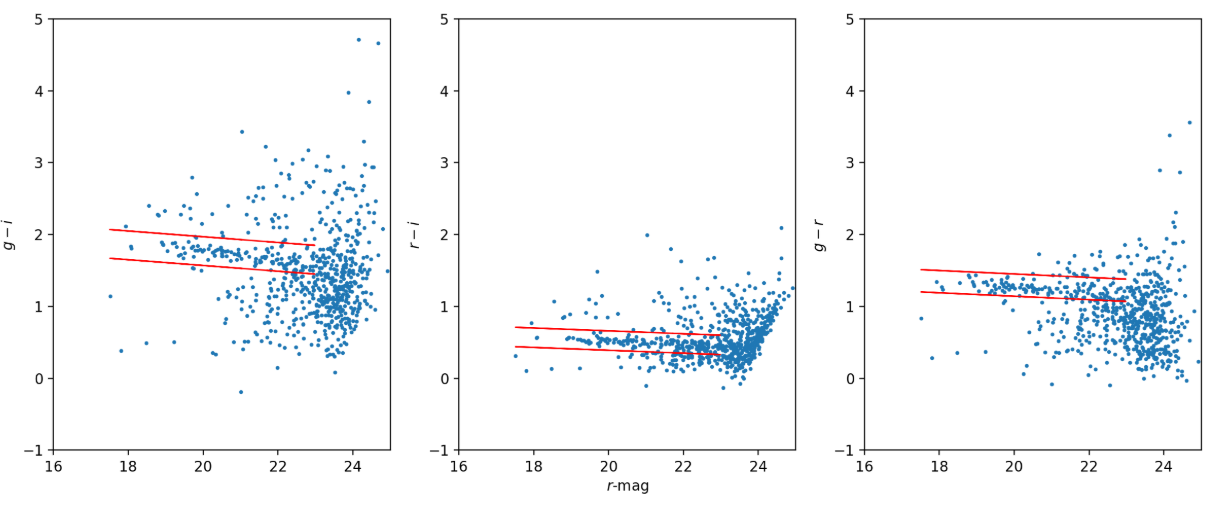
Fig. 2 Color-magnitude diagrams of galaxies near the BCG, plotted with the AnaCal r-band magnitude on the x-axis and AnaCal colors on the y-axis. From left to right, we show g-i, r-i, and g-r colors, with the red-sequence overdensity clearly visible.#
We identify the red sequence in each color by eye, applying magnitude cuts of \(17 < r < 23.5\) as illustrated in Fig. 2. Any object classified as belonging to all three red sequences is excluded from the shear catalog used in the cluster lensing analysis.
Shear Profile#
The resulting shear profile is shown in Fig. 3. It is computed using galaxy shapes and their shear responses, binned into six evenly spaced radial bins spanning from 0.35 Mpc to 6.5 Mpc. The error bars represent 68% confidence intervals, estimated via bootstrap resampling within each radial bin, ordered from smallest to largest separation.
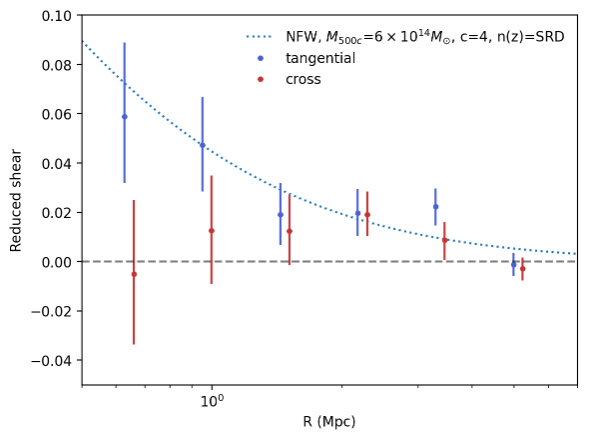
Fig. 3 The reduced shear profile around A360 for both tangential (blue) and cross (red) shear measurements, using the cuts described throughout the technote. Both measured profiles have 68% confidence intervals.#
The theoretical shear profile is generated using the Cluster Lensing Mass Modeling (CLMM) code [Aguena et al., 2021]. This model serves as a rough reference and is not fitted to the calibrated shear measurements. It assumes a Navarro-Frenk-White (NFW) halo with a cluster mass of \(M_{500c} = 6 \times 10^{14}, M_\odot\) [Hilton et al., 2021] and a concentration parameter of 4. We wrongly assume the Y10 source redshift distribution from the LSST Dark Energy Science Collaboration’s Science Requirements Document (SRD) [The LSST Dark Energy Science Collaboration et al., 2018].
Because of the limited galaxy sample, the weak-lensing measurements around individual clusters are inherently noisy, as evident in the figure. Even so, the cross-shear signal (orange) fluctuates around zero across the full redshift range, while the tangential shear shows a clear positive trend that grows toward the cluster center. A statistical test confirms this: the tangential shear is detected at \(5.06\sigma\) significance (\(p = 2.5 \times 10^{-4}\)), whereas the cross shear is consistent with zero (\(p = 0.30\)).
Conclusion#
In the low-ecliptic-latitude field of the Rubin 2024 LSSTComCam campaign, we ran the AnaCal shear estimator on coadded images. To avoid contamination from cluster member galaxies, red-sequence galaxies were identified and removed based on AnaCal magnitudes in the \(griz\) bands. This allowed us to measure the shear profile around A360, yielding a detection at \(5\sigma\) significance.
References#
Prakruth Adari, Anja von der Linden, Tianqing Zhang, and others. Source Selection for Abell 360 in LSSTComCam Data Preview 1. Commissioning Technical Note SITCOMTN-163, NSF-DOE Vera C. Rubin Observatory, July 2025. URL: https://sitcomtn-163.lsst.io/, doi:10.71929/rubin/2571157.
C. Combet, A. Plazas Malagón, S. Fu, and others. PSF assessment in the field of Abell 360 and shapeHSM shear profile using LSSTComCam data. Commissioning Technical Note SITCOMTN-161, NSF-DOE Vera C. Rubin Observatory, October 2025. URL: https://sitcomtn-161.lsst.io/, doi:10.71929/rubin/2572986.
Miranda R. Gorsuch, Arun Kannawadi, Prakruth Adari, and others. Testing the implementation of Metadetection and Cell-Based Coadds on Abell 360 LSSTComCam data. Commissioning Technical Note SITCOMTN-162, NSF-DOE Vera C. Rubin Observatory, October 2025. URL: https://sitcomtn-162.lsst.io/, doi:10.71929/rubin/3000578.
M. Aguena, C. Avestruz, C. Combet, and others. CLMM: a LSST-DESC cluster weak lensing mass modeling library for cosmology. MNRAS, 508(4):6092–6110, December 2021. arXiv:2107.10857, doi:10.1093/mnras/stab2764.
M. Hilton, C. Sifón, S. Naess, and others. The Atacama Cosmology Telescope: A Catalog of >4000 Sunyaev-Zel\textquoteright dovich Galaxy Clusters. ApJS, 253(1):3, March 2021. arXiv:2009.11043, doi:10.3847/1538-4365/abd023.
Xiangchong Li. Analytical weak-lensing shear response of galaxy model fitting. arXiv e-prints, pages arXiv:2506.16607, June 2025. arXiv:2506.16607, doi:10.48550/arXiv.2506.16607.
Xiangchong Li, Nobuhiko Katayama, Masamune Oguri, and Surhud More. Fourier Power Function Shapelets (FPFS) shear estimator: performance on image simulations. MNRAS, 481(4):4445–4460, December 2018. arXiv:1805.08514, doi:10.1093/mnras/sty2548.
Xiangchong Li, Yin Li, and Richard Massey. Weak gravitational lensing shear measurement with FPFS: analytical mitigation of noise bias and selection bias. MNRAS, 511(4):4850–4860, April 2022. arXiv:2110.01214, doi:10.1093/mnras/stac342.
Xiangchong Li and Rachel Mandelbaum. Analytical weak-lensing shear responses of galaxy properties and galaxy detection. MNRAS, 521(4):4904–4926, June 2023. arXiv:2208.10522, doi:10.1093/mnras/stad890.
Xiangchong Li, Rachel Mandelbaum, and The LSST Dark Energy Science Collaboration. Analytical noise bias correction for precise weak lensing shear inference. MNRAS, 536(4):3663–3676, February 2025. arXiv:2408.06337, doi:10.1093/mnras/stae2764.
Andy Park, Xiangchong Li, and Rachel Mandelbaum. Accurate shear estimation with fourth-order moments. MNRAS, 537(1):507–519, February 2025. arXiv:2411.13648, doi:10.1093/mnras/staf053.
Erin S. Sheldon, Matthew R. Becker, Michael Jarvis, Robert Armstrong, and LSST Dark Energy Science Collaboration. Metadetection Weak Lensing for the Vera C. Rubin Observatory. The Open Journal of Astrophysics, 6:17, May 2023. arXiv:2303.03947, doi:10.21105/astro.2303.03947.
The LSST Dark Energy Science Collaboration, Rachel Mandelbaum, Tim Eifler, and others. The LSST Dark Energy Science Collaboration (DESC) Science Requirements Document. arXiv e-prints, pages arXiv:1809.01669, September 2018. arXiv:1809.01669, doi:10.48550/arXiv.1809.01669.